Students taking Introduction to Business Intelligence (ISM3116) frequently face assignments involving real-world data issues, such as missing entries, conditional formulas, and statistical interpretation in Microsoft Excel. One classic exercise asks students to analyze a blood pressure dataset representing 1,000 individuals to determine whether missing values in the dataset occur randomly or if they contain meaningful, "informative" patterns related to health outcomes.
Real-world business and health data is rarely clean. Missing values can skew reporting, lead to poor forecasting, and misinform strategic decision-making. Through this assignment, students learn how to think critically about data quality and evaluate how statistical adjustments like "mean imputation" can introduce unintended bias into business reports.
Our business intelligence and statistics tutors are ready to help you write formulas, construct professional dashboards, and write top-tier analysis reports.
Get a free custom help quote today!
The ISM3116 Blood Pressure Assignment Overview
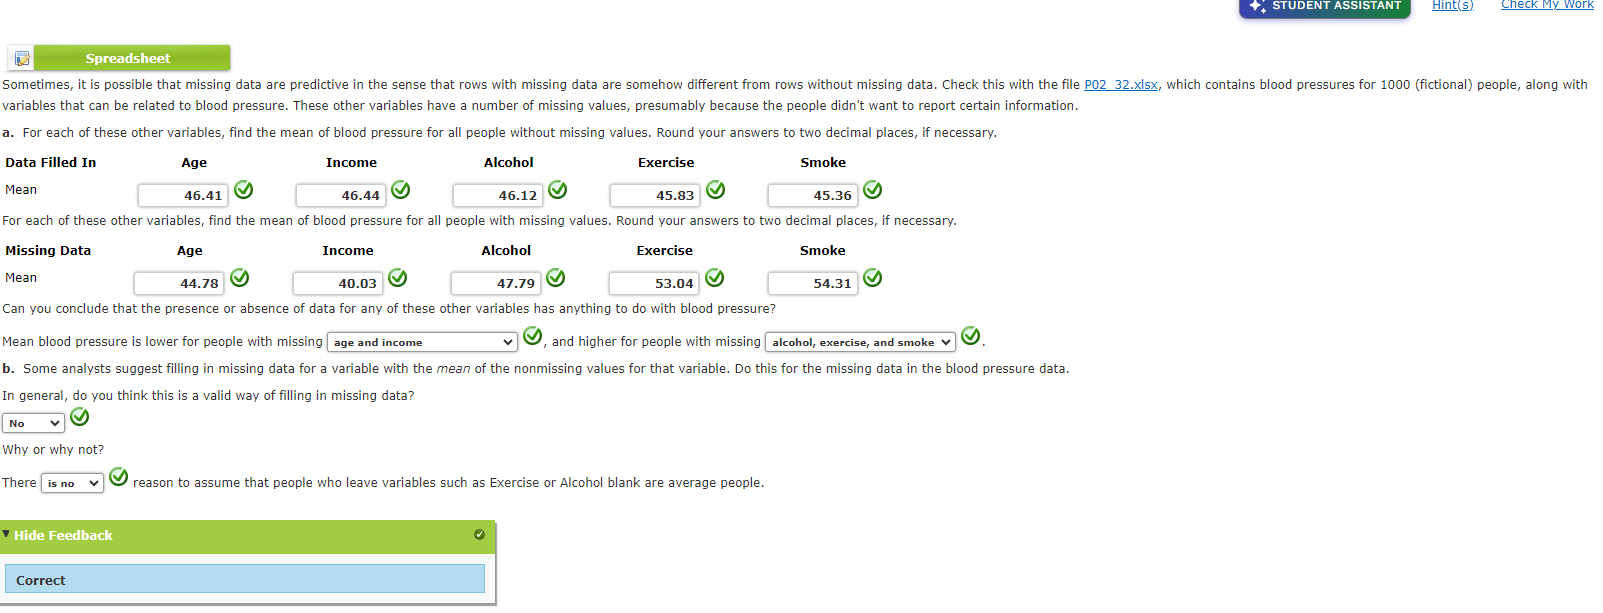
The assignment typically provides a dataset containing blood pressure measurements and demographic/lifestyle characteristics for 1,000 subjects. The primary variables include:
- Age: Age of the participant.
- Income: Household income.
- Alcohol Consumption: Frequency or weekly consumption.
- Exercise Habits: Active hours or category of exercise.
- Smoking Status: Smoker vs. Non-smoker.
- Blood Pressure (Systolic/Diastolic): The primary outcome variable (which frequently has missing values).
Students are asked to divide the dataset into two main groups: individuals with complete records and individuals with missing values. By comparing these groups across the demographic and lifestyle variables, students must determine if the missing data is random or predictive of underlying health status.
Step-by-Step Analytical Process in Excel
To successfully complete the assignment, students must perform a series of descriptive operations. Below is the standard workflow required to obtain the statistical solutions.
1. Isolating and Filtering Missing Values
The first step is classifying records based on whether they contain missing data. In Excel, this is done by filtering the dataset:
- Using Excel Filters: Highlight your header row, click Data > Filter. Go to the dropdown arrow of the column containing missing values (e.g., Blood Pressure) and check only the (Blanks) option. This will isolate the incomplete records.
- Creating an Indicator Column: Analysts often add a helper column named
IsMissingwith the formula:=IF(ISBLANK(F2), 1, 0)
Where columnFrepresents the blood pressure values. This indicator can be used in pivot tables or conditional sums.
2. Calculating Conditional Means
You need to compare averages across groups (complete vs. missing records). To calculate these
conditional averages without manual sorting, use Excel's AVERAGEIF and
AVERAGEIFS functions:
- Average Income for Complete Data:
=AVERAGEIFS(IncomeRange, BloodPressureRange, "<>")
Here,"<>"tells Excel to only average rows where the blood pressure cell is not blank. - Average Income for Missing Data:
=AVERAGEIFS(IncomeRange, BloodPressureRange, "=")
This calculates the mean income only for participants whose blood pressure entries are blank.
Understanding Informative vs. Random Missingness
A core question in the ISM3116 assignment is: Is the missing data random or informative?
In data science, we classify missing data into three categories:
- Missing Completely at Random (MCAR): The missingness has nothing to do with any variables in the dataset. For instance, a blood tube broke in the lab, or a questionnaire page got lost by accident.
- Missing at Random (MAR): The missingness depends on an observed variable but not the missing value itself. For example, younger people might be less likely to report blood pressure, but within age brackets, missingness is random.
- Missing Not at Random (MNAR / Informative): The missingness is directly related to the value that is missing. For example, individuals with very high blood pressure might feel unwell or self-conscious and choose not to report it.
If your Excel calculations show that the missing-data group has a significantly higher average age, higher alcohol consumption, or a higher smoking rate than the complete-data group, the missingness is informative. Lifestyle factors linked to high blood pressure are correlated with non-reporting. Thus, the missing values are likely hiding higher-than-average blood pressure readings!
Explore how imputing (filling in) missing data with the overall mean changes the variance and standard deviation of a dataset. When you replace blanks with the average, you artificially shrink the statistical spread.
Why Mean Imputation is Inappropriate
Mean Imputation is the practice of replacing missing values in a column with the mean of the observed values. While it is easy to execute in Excel, business intelligence instructors look for a strong critical evaluation of this method:
- Artificially Reduces Variance: By adding multiple data points exactly at the mean, you make the dataset appear more consistent than it is. It artificially squeezes standard deviation, which distorts risk calculations.
- Introduces Severe Bias: If the data is Missing Not at Random (informative), the true mean is different from the observed mean. Imputing the observed mean locks in a biased average.
- Understates Standard Errors: Statistical testing packages assume all input numbers are real observations. Fabricating data points makes sample sizes look larger and margins of error look smaller, leading to false statistical confidence.
Business and Analytical Implications
In business intelligence, recognizing data missingness patterns is critical. Consider these corporate scenarios:
- → Customer Satisfaction Surveys: If customers with poor experiences chose not to complete surveys, ignoring missing data will lead to an artificially inflated Net Promoter Score (NPS).
- → Credit Scoring and Risk: If borrowers with high debt levels omit income disclosures, treating their missing values as average will lead to underestimating loan default rates.
Access the Complete Statistical Solution
For a detailed breakdown of the calculations and methodologies used in this analysis, you can explore the complete walkthrough and analytical repository:
📂 Visit the Missing Data Analysis GitHub Repository
Need Help with Your ISM3116 Assignments?
If you're studying business analytics, descriptive statistics, or dashboard design and are struggling to apply these techniques, we can help. Our expert tutors regularly support students taking ISM3116 and other business intelligence courses.
Whether you need help with:
- Conditional averaging and complex filtering formulas in Excel.
- Structuring professional reports with clean statistical formatting.
- Creating dynamic dashboards and charts that stand out.
- Understanding predictive analytics, logistic regressions, or clustering.
Fill out the contact form below or reach out to us on WhatsApp, and we will get back to you with a transparent quote to complete your assignment or explain the concepts step-by-step.
Excel in Business Intelligence
Let us help you clear the confusion around Excel formulas, missing data concepts, and statistical interpretations. Get the grade you want with personalized tutoring and professional support.
Get Custom Assignment Help