If you're taking MAT 240: Applied Statistics, you've probably discovered that the course project is very different from a typical homework assignment. Instead of answering multiple-choice questions, you're expected to analyze a real dataset, create graphs, interpret statistical results, and write a professional report.
For many students, this is the first time they've been asked to combine statistics with data analysis and business communication. The calculations are only one part of the project—the real challenge is explaining what the results actually mean.
This guide will help you understand every major section of the MAT 240 project so you can complete your report with confidence.
Check out our comprehensive SNHU MAT 240 course guide where we detail how to navigate zyBooks, configure the real estate housing datasets, and solve module projects.
Read the SNHU MAT 240 Applied Statistics Guide →
What Is the MAT 240 Project?
The MAT 240 project is designed to test your ability to apply statistical concepts to real-world data rather than simply memorizing formulas.
Depending on your instructor and module, you'll typically be asked to:
- Select a representative sample from a larger dataset.
- Calculate descriptive statistics.
- Compare your sample with the overall population.
- Create charts and graphs in Excel.
- Build and interpret a regression model.
- Identify patterns and possible outliers.
- Write a professional statistical report.
Your goal isn't just to produce numbers—it's to explain what those numbers tell you about the data.
Section 1: Creating a Representative Sample
One of the first tasks is selecting a random sample from the dataset.
Many students assume that choosing the first rows in the spreadsheet is acceptable, but that's not truly random.
A representative sample should:
- Give every observation an equal chance of being selected.
- Reflect the characteristics of the larger population.
- Reduce selection bias.
If your sample is representative, your statistical conclusions are more likely to reflect the entire dataset accurately.
Section 2: Calculating Descriptive Statistics
Once you've created your sample, you'll calculate summary statistics such as:
- Mean (the average value)
- Median (the middle value)
- Standard deviation (the measure of variation or spread)
These statistics help describe the center and spread of your data. Instead of simply reporting the numbers, explain what they tell you. For example:
- Is the average selling price relatively high or low?
- Is there a large amount of variation?
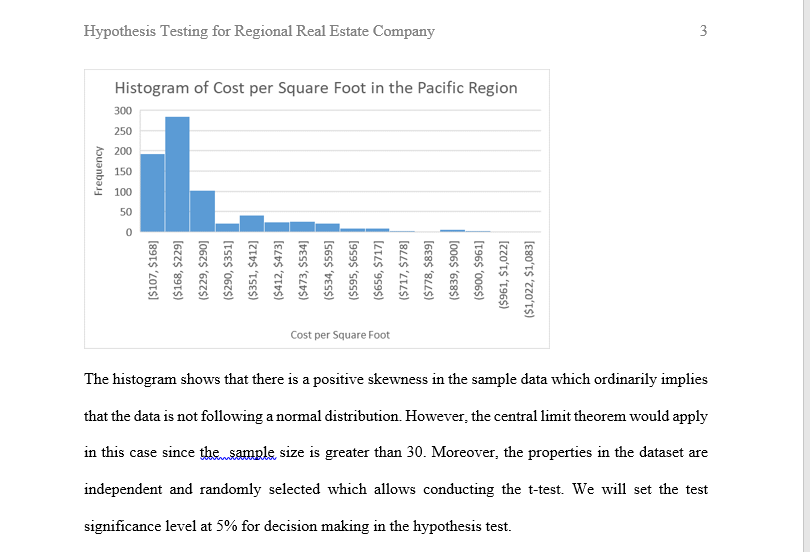
- Does the median differ noticeably from the mean? (This helps indicate skewness!)
Good statistical reports always interpret the results rather than listing them.
Section 3: Comparing Your Sample With the Population
This is one area where many students lose points. The project usually asks you to compare your regional sample with national statistics.
Instead of saying: "The averages are different," explain:
- How similar are the averages?
- Is the variation larger or smaller?
- Does your sample appear representative?
- Are there noticeable differences between regions?
Your instructor wants to know whether you can evaluate how well your sample reflects the larger population.
Section 4: Building a Scatterplot
The scatterplot is often the first visual analysis in the project. A good scatterplot allows you to observe whether two variables appear to be related.
Ask yourself:
- Does the graph trend upward? (Positive association)
- Does it trend downward? (Negative association)
- Is there no clear relationship? (No association)
- Are the points closely clustered or widely scattered? (Strength of relationship)
You should also add a regression trendline to summarize the relationship visually.
Section 5: Understanding the Regression Equation
Many students copy the regression equation into their report without explaining it. Instead, ask:
- What does the slope tell us? For every one-unit increase in the independent variable, how much does the dependent variable change?
- What does the intercept represent? What is the predicted value when the independent variable is zero?
- Which variable is being used to predict the other? Identify your independent variable (predictor) and dependent variable (response).
In most MAT 240 projects, one variable serves as the predictor (independent variable), while the other is the response (dependent variable). Understanding this relationship is more important than memorizing the equation.
Section 6: Predicting Values
Your project may ask you to estimate a value using the regression equation. This isn't just a calculation—it's an opportunity to explain what the prediction means in context.
Always remember that predictions are estimates based on the observed relationship in your sample. Be cautious of extrapolation—predicting values far outside the range of your observed data can lead to highly unreliable results.
Section 7: Identifying Outliers
Outliers are observations that differ noticeably from the rest of the data.
When discussing outliers, consider questions such as:
- Could the value represent an unusual observation?
- Could it be caused by measurement or data entry error?
- Does it represent a unique property or situation?
Avoid assuming every outlier is a mistake. Sometimes unusual values provide valuable insights into market dynamics or extreme conditions.
Confused about whether your p-value is significant or what decision to write in your report? Enter your p-value and alpha level to get a ready-to-use APA conclusion.
Open the Free P-Value Interpreter →
Writing Like a Data Analyst
One of the biggest differences between MAT 240 and a traditional math class is that you're expected to communicate your findings clearly.
Instead of writing only calculations, explain:
- What you observed.
- Why the results matter.
- What conclusions can reasonably be drawn.
- Any limitations of the analysis.
Think of yourself as preparing a report for a business manager rather than completing a worksheet.
Common Mistakes Students Make
Some of the most common issues include:
- Selecting a non-random sample (e.g. just taking the top 100 rows).
- Reporting statistics without interpretation.
- Confusing correlation with causation.
- Ignoring unusual observations.
- Misinterpreting regression results.
- Writing conclusions that are not supported by the data.
Carefully reviewing each section before submitting your report can help you avoid these errors.
Need Help With Your MAT 240 Project?
If you're working on a MAT 240 project and feel stuck, you don't have to figure it out alone.
Whether you're unsure how to create your sample, calculate descriptive statistics, interpret a scatterplot, explain a regression equation, or write your conclusions, getting step-by-step guidance can make the project much less intimidating.
The objective isn't simply to finish the assignment—it's to understand the statistical reasoning behind every part of your analysis. Once you learn that process, future projects become much easier.
Struggling with Your SNHU MAT 240 Project?
Get expert guidance from professional statistics tutors who understand the exact rubric requirements. From generating random samples and running Excel regression to writing up your APA-formatted final report, we can help you succeed.
Get SNHU Statistics HelpFinal Thoughts
MAT 240 projects are designed to help you think like a data analyst. While the calculations are important, your ability to interpret results and communicate meaningful conclusions is what ultimately demonstrates your understanding.
By approaching the project one section at a time, you'll build confidence in using Excel, analyzing data, and explaining statistical findings in a clear and professional manner.