
Southern New Hampshire University (SNHU) students taking MAT 240: Applied Statistics often find themselves overwhelmed. At first glance, standard homework in zyBooks feels doable, but once the module projects and Excel assignments arrive, many students get stuck.
Over the years, we've worked closely with dozens of SNHU students to navigate MAT 240. The primary roadblock for most students is interpreting the results and writing the final analysis report. Our specialized SNHU MAT 240 statistics help service breaks down complex statistical concepts and handles your entire assignment load with precision.
Our expert statistics tutors help you run regression models in Excel, generate correct charts, interpret your p-values, and write a stellar final paper.
Key SNHU MAT 240 Modules & Project Breakdown
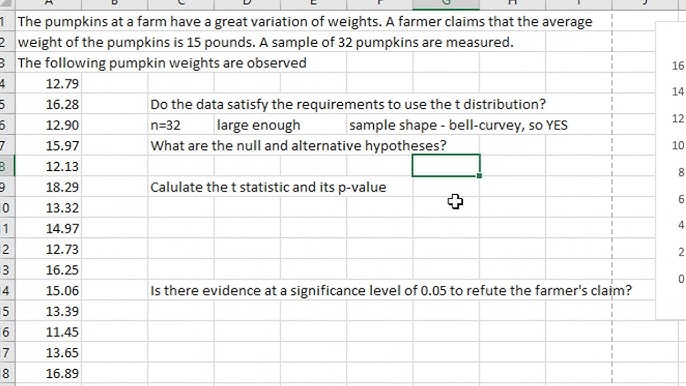
The MAT 240 curriculum is structured around several major statistical benchmarks, culminating in two critical project submissions that require statistical software (specifically MS Excel):
1. Descriptive Statistics & Visualizations (Module 2 & 3)
Students must download the Real Estate Housing Dataset (representing home listings in different regions like East North Central, Pacific, New England, etc.) and calculate:
- Mean, Median, and Mode of home prices or square footage.
- Variance and Standard Deviation.
- Histograms and Box Plots to identify shapes of distributions and locate outliers.
The Trap: Simply generating a histogram isn't enough. You must write an analysis explaining whether the distribution is symmetric, skewed-right, or skewed-left, and what that implies for regional property valuations.
2. Confidence Intervals (Module 5 Project One)
Using a sample of 100 properties, students calculate a 95% Confidence Interval for the mean housing price in a chosen region. See also our specific guide on MAT 240 Module 5 House Listing Price by Region. You are required to explain:
- How the sample size affects the margin of error.
- The difference between the sample mean ($\bar{x}$) and the population mean ($\mu$).
- A precise interpretation: "We are 95% confident that the true population mean of house prices lies between..."
3. Hypothesis Testing (Module 6 & 7)
Hypothesis testing is where many students experience a major drop in grades. You will construct a one-sample t-test (or z-test) to evaluate a specific claim (e.g., whether the average price per square foot exceeds a national average).
Key requirements include defining:
- The Null Hypothesis ($H_0$) and Alternative Hypothesis ($H_a$).
- Evaluating the Test Statistic and calculating the P-value.
- Making a decision: Reject $H_0$ if P-value $\le \alpha$, or Fail to Reject $H_0$ if P-value $> \alpha$.
4. Simple Linear Regression (Module 8 Project Two)
The final milestone involves examining the relationship between a predictor variable (e.g., square footage) and a response variable (e.g., listing price). You will use Excel's Data Analysis Toolpak to generate a regression output sheet.
Why Linear Regression Causes the Most Confusion
Generating a regression table takes three clicks in Excel. The challenge is explaining what the table actually tells you about real-world scenarios. Instructors look for clean explanations of:
- Slope ($\beta_1$): For every one-unit increase in the independent variable (square foot), how much does the dependent variable (listing price) change on average?
- Intercept ($\beta_0$): What is the predicted price when square footage is zero?
- R-Squared ($r^2$): The proportion of variance in the housing prices that can be predicted from square footage.
- P-Value of the Slope: Is the relationship statistically significant, or could it have happened by random chance?
Practical Tips to Ace your MAT 240 Projects
- ➔ Use the SNHU Project Templates: SNHU provides Word templates with specific prompts. Type your answers directly underneath them.
- ➔ Double-Check Your Region: Make sure you filter for the correct region assigned to you.
- ➔ Verify Outliers: Explicitly state if outliers exist and discuss how they affect the mean vs. the median.
Get Expert SNHU Tutors
If you're busy, overwhelmed, or struggling to make sense of the statistical requirements of your assignments, we can help. Our service connects you with expert tutors who understand the exact rubric requirements for SNHU courses.
- zyBooks homework modules and participation activities.
- Excel spreadsheet configurations, charts, and analysis toolpak outputs.
- Module 3 and Module 5 Project One papers.
- Module 8 Project Two regression papers.
- Explaining statistical interpretations in simple, plain English.
Struggling with SNHU MAT 240?
Don't let Excel formulas, p-value calculations, or APA write-ups stress you out. Reach out today to get expert assignment help, detailed explanations, and high-quality solutions designed to boost your grade.
Get SNHU Statistics Help