If you're taking a statistics class, you will inevitably encounter the t-test. It's one of the most common statistical tests used in research, but figuring out which t-test to use — and when — can be confusing. This guide breaks down all three main types with plain-English explanations and real-world examples.
Our expert tutors can check your work, write up the APA results, or explain the math step-by-step. Get a free quote today.
1. What Is a T-Test?
A t-test is an inferential statistic used to determine if there is a significant difference between the means of two groups. Simply put, it helps you answer the question: "Are these two averages truly different from each other, or did this difference happen by random chance?"
T-tests produce a t-statistic and a p-value. If p < 0.05 (the conventional significance threshold), you can conclude the difference between groups is statistically significant.
2. The Independent Samples T-Test
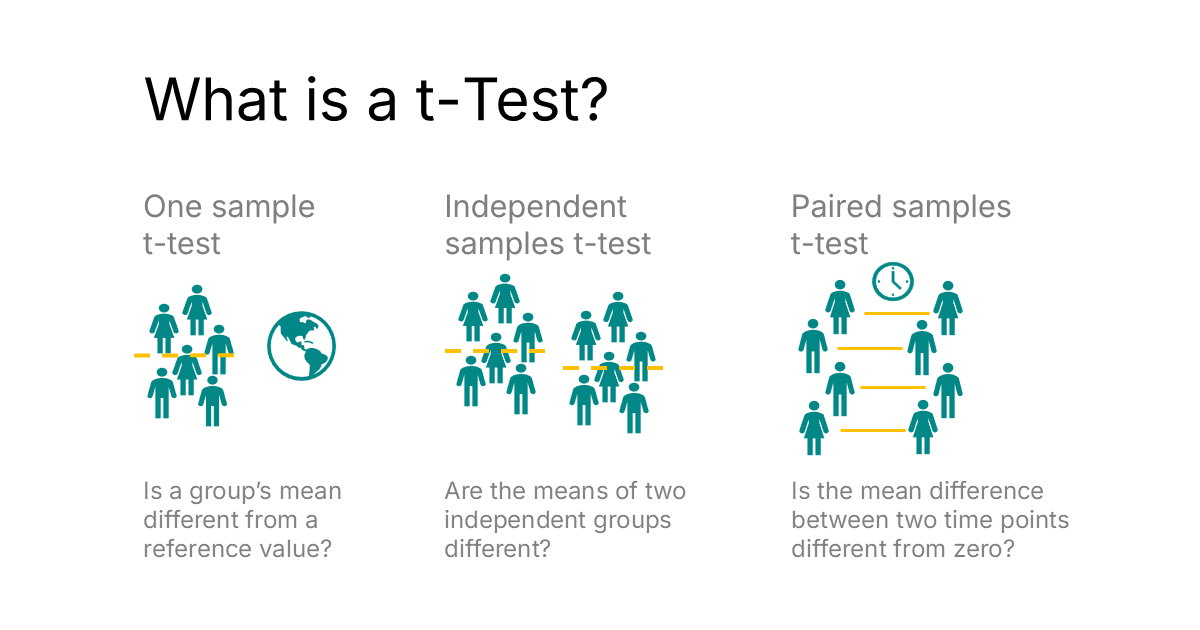
When to use it: Use this test when you want to compare the means of two completely separate, independent groups.
- Example: Comparing the test scores of Group A (students who drank coffee) and Group B (students who didn't drink coffee).
- Assumption: The people in Group A are entirely different from the people in Group B — no overlap.
- In SPSS: Analyze → Compare Means → Independent-Samples T Test
3. The Paired Samples T-Test (Dependent)
When to use it: Use this test when you want to compare the means of the same group of people at two different times or under two different conditions.
- Example: Measuring students' test scores before tutoring and measuring the exact same students' scores after tutoring.
- Assumption: The data pairs are linked (e.g., pre-test/post-test from the same participants).
- In SPSS: Analyze → Compare Means → Paired-Samples T Test
4. The One-Sample T-Test
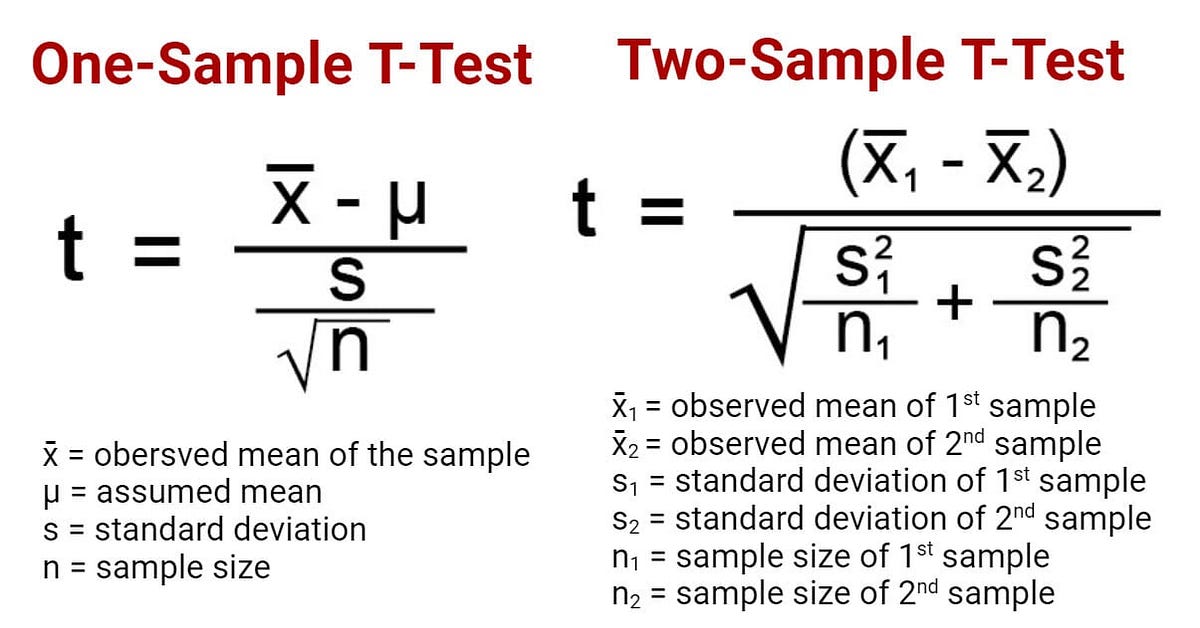
When to use it: Use this test when you want to compare the mean of one specific group to a known or hypothesized population mean.
- Example: Testing if the average height of basketball players at a specific college is significantly different from the national average (a known value).
- In SPSS: Analyze → Compare Means → One-Sample T Test
5. Quick Decision Table
| Situation | T-Test to Use |
|---|---|
| Two separate, unrelated groups (e.g., males vs. females) | Independent Samples T-Test |
| Same group measured twice (pre/post, before/after) | Paired Samples T-Test |
| One group compared to a known population mean | One-Sample T-Test |
| Comparing more than two groups | ANOVA (not a t-test) |
6. Key Assumptions to Check Before Running a T-Test
- Normality: The data should be approximately normally distributed (less critical with large samples due to the Central Limit Theorem).
- Independence: Observations should be independent of each other (except in the paired t-test).
- Homogeneity of variance (Independent T-Test only): Both groups should have similar variances. SPSS tests this with Levene's Test — if p < 0.05, use the "Equal variances not assumed" row.
- Scale of measurement: The dependent variable should be interval or ratio scale.
7. Step-by-Step: Running an Independent T-Test in SPSS
- Click Analyze → Compare Means → Independent-Samples T Test
- Move your continuous variable (e.g., Test Score) to the Test Variable(s) box.
- Move your grouping variable (e.g., Treatment Group) to the Grouping Variable box.
- Click Define Groups and enter the two group values (e.g., 1 and 2). Click Continue.
- Click OK to run the test.
- Check Levene's Test first. Then read the t-statistic and p-value from the appropriate row.
"An independent-samples t-test was conducted to compare [DV] between [Group 1] and [Group 2]. There was a significant difference in [DV] for [Group 1] (M = __, SD = __) and [Group 2] (M = __, SD = __); t(df) = __, p = .__."
8. Conclusion
Choosing the right t-test comes down to analyzing your groups: Are they separate (Independent), the same people measured twice (Paired), or one group compared to a known standard (One-Sample)?
Mastering these distinctions is key to running accurate analyses in software like SPSS, R, or Python. If you find yourself stuck on an output table or deciding which test to run for your dissertation, don't hesitate to reach out to our team of experts.